
Same full occupancy, a different next year
Even with the same full occupancy and the same gross yield, next year's income changes if move-in timing and the current market rent differ. We read the history from the list of lease contracts.

BENERU writes for readers who live in Japan. Taxes, loans and the other rules described here are those of Japan, and they assume a resident of Japan.
This page is a translation of the Japanese original. If the two differ, the Japanese original prevails.
Good day.
There are 2 properties.
The following is a fictional example for illustration.
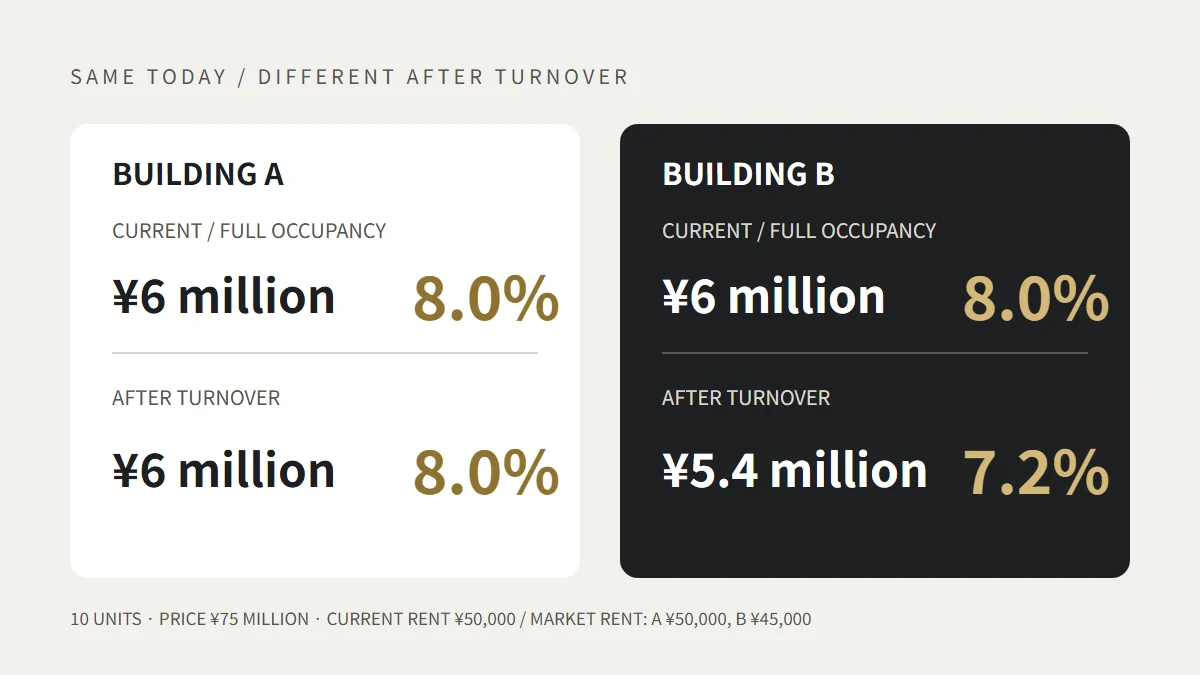
Both have 10 units. Both are fully occupied. Rent is ¥50,000 a month per unit, and annual rental income is ¥6 million. The price is also the same, ¥75 million.
The gross yield is 8.0% for both.
Lining up the materials and comparing them, all the numbers are the same.
Now, which would you buy?
Let us look at the list of lease contracts. It lists the rent for each unit and when each contract started.
Building A
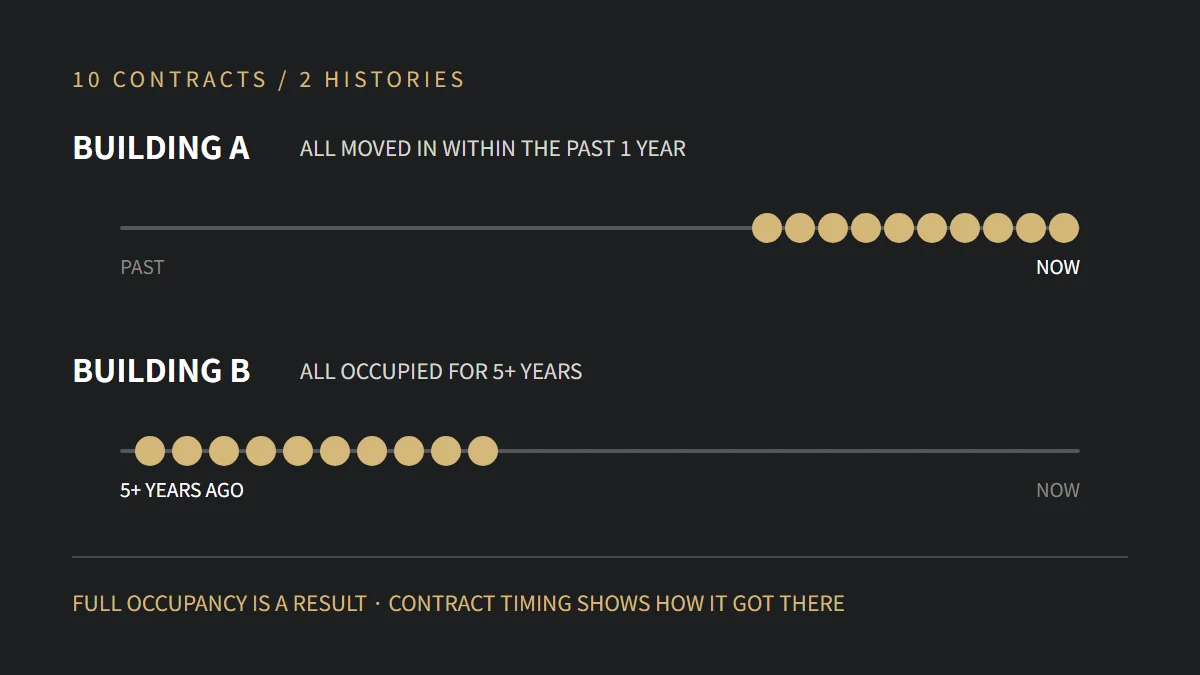
All 10 units moved in within the past 1 year. Rent is ¥50,000, the same as the current market rent.
Building B
All 10 units have been occupied for 5 years or more. Rent is ¥50,000. But if the same units were advertised now, it would be ¥45,000.
Here, the numbers start to move.
Today's ¥6 million is not the same ¥6 million
The tenants in Building B pay ¥5,000 more than today's market rent. Because they have kept living there at the old level.
This disappears the moment someone moves out. The next advertisement will be ¥45,000.
Let us reset and look at the numbers after every unit has turned over.
- Building A: stays at ¥6 million a year
- Building B: ¥5.4 million a year
In yield terms, 8.0% and 7.2%.
Same full occupancy, same materials, and a property listed at 8.0% actually holds a different number.
This is not a misrepresentation. The gross yield is calculated with current rent, so 8.0% is correct. But how many years that 8.0% will last is written outside the table.
That said, Building A is not necessarily better
Reading this far, it looks as if you should just choose Building A. Not necessarily.
In Building A, all 10 units turned over within 1 year.
In an ordinary apartment building, that does not happen much. There must be some reason.
Was a new building built nearby? Is the equipment so old that people cannot keep living there? Is management not working? Or were all the units filled at once in order to sell?
In the last case, move-outs will continue at the same pace from next year. The cost of tenant placement comes each time.
Building B, on the other hand, has had no one leave for 5 years or more. Even though the rent is above market.
Whether it is that comfortable to live in, or the tenants are people who find moving a bother, the reason is unknown. But there is a possibility it will not decrease right away.
Building A's current numbers continue, but turnover may be fast. Building B's numbers go down, but it may take time before they do.
Which is better cannot be decided from these materials alone.
What you look at is not whether it is fully occupied
Full occupancy is a result. What you want to know is how it got that way.
In the list of contracts, 3 points are enough to look at.
Since when have the tenants lived there? If the contract dates are all bunched together, move-outs will be bunched together too.
Is that rent an amount that can still be charged today? The current rent, and how much it would be if advertised now. This gap is the future decrease.
And why is it in that state?
The third is not in the materials, so you will have to ask. There are things you will not learn even if you ask, but if you do not ask, you certainly will not learn them.
When I see a shop with a line, I can't help counting how long the line is.

But even at the same length, what is inside probably differs.
A line of older regulars who queue every week, and a line of people who gathered after the shop was featured on TV yesterday.
Today's sales may be the same, but the line still there in half a year is probably only one of them.
Standing in front of the shop, you cannot see that difference. You can only ask the people in line, or have come the week before as well.